
The question
Online revenue changed between January and February. Did the business sell less overall, or did the channel mix change?
Work through the analysis
Check the grain and input quality
Each valid order should appear once. Parse dates, calculate quantity × unit price using Decimal, and reject invalid records before grouping. Keep the first valid occurrence of each order ID and report the removed CSV lines.
Compare the same units
Group clean orders by month and channel. Count orders separately from revenue. The downloaded channel-summary.csv contains the values behind the chart.
Explain the arithmetic before proposing a cause
The sample has 60 clean orders in each month and €2,670.00 revenue in each month. Online revenue falls from €1,602.00 to €1,068.00 while store revenue rises by the same amount. Total revenue is unchanged.
Calculated results
- input rows
- 125
- valid orders
- 120
- dataset revenue
- €5340.00
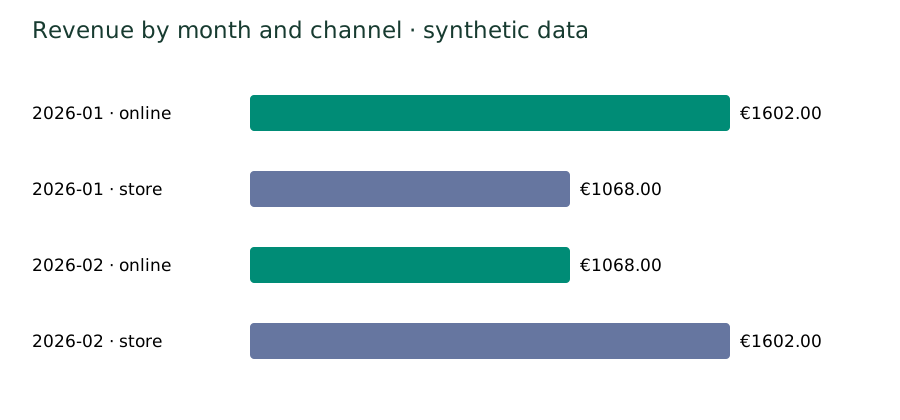
| Month | Channel | Orders | Revenue (EUR) |
|---|---|---|---|
| 2026-01 | online | 36 | 1602.00 |
| 2026-01 | store | 24 | 1068.00 |
| 2026-02 | online | 24 | 1068.00 |
| 2026-02 | store | 36 | 1602.00 |
What the result can and cannot tell you
In this dataset, the change is a channel shift rather than a fall in total revenue. That describes the sample; it does not explain customer behavior. Traffic, conversion, returns, and marketing activity are not present, so they cannot be used to establish a cause. Investigate those sources before recommending a campaign change.
Change one quantity in input.csv and rerun the script. Explain how the monthly total and channel chart change. Add a data-quality check of your own and document what it catches.
Download and reproduce
Run locally with Python 3
python3 analyze.py --input input.csv --output resultsUses Python 3 and its standard library. No API keys or additional packages are required.
Build work you can explain
Create a learner account to request access to guided projects. Review prerequisites and access conditions before choosing a course.